


Everton
Season
- Position
- 14th
- Points
- 10
- Record
- 2-4-2
- Goal difference
- −1
- Projected points
- 45.8
- Win the title
- <1%
- Finish in the top 4
- 1%
- Go down
- 14%
The team's chances of winning the title, finishing in the Champions League places, and going down, as the forecast stood each week. Hover or tap the chart to see any week.
| Date | Title | Champions League | Relegated |
|---|---|---|---|
| Aug 17 | <1% | 2% | 28% |
| Aug 24 | <1% | 2% | 20% |
| Aug 31 | <1% | 3% | 13% |
| Sep 7 | <1% | 3% | 13% |
| Sep 14 | <1% | 3% | 10% |
| Sep 21 | <1% | 4% | 7% |
| Sep 28 | <1% | 4% | 6% |
| Oct 5 | <1% | 4% | 6% |
| Oct 12 | <1% | 5% | 5% |
| Oct 19 | <1% | 1% | 13% |
| Oct 26 | <1% | 1% | 14% |
| Nov 2 | <1% | 1% | 14% |
Table


Top players
Goals
Assists
Clean sheets
Squad
Goalkeepers
 Jordan Pickfordnumber 1,
 England,32 years old
 Mark Traversnumber 12,
 Ireland,27 years old
 Tom Kingnumber 31,
 Wales,31 years old
Defenders
 Jarrad Branthwaitenumber 4,England,24 years old
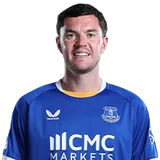 Michael Keanenumber 5,England,33 years old
 James Tarkowskinumber 6,England,33 years old
 Jake O'Briennumber 15,Ireland,25 years old
 Vitalii Mykolenkonumber 16,
 Ukraine,27 years old
Midfielders
 Ainsley Maitland-Nilesnumber 2,England,29 years old
 Kiernan Dewsbury-Hallnumber 8,England,28 years old
 Jack Grealishnumber 10,England,31 years old
 Christian Nørgaardnumber 23,
 Denmark,32 years old
 Charly Alcaraznumber 24,
 Argentina,23 years old
 Hayden Hackneynumber 30,England,24 years old
 Merlin Röhlnumber 34,
 Germany,24 years old
 James Garnernumber 37,England,25 years old
 Harrison Armstrongnumber 45,England,19 years old
- Malik Olayiwolanumber 76,England,17 years old
- Harvey Fosternumber 81,England,19 years old
Forwards
 Thierno Barrynumber 11,
 France,24 years old
 Tyrique Georgenumber 19,England,20 years old
 Tyler Diblingnumber 20,England,20 years old
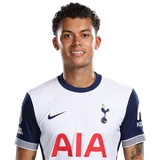 Brennan Johnsonnumber 22,Wales,25 years old
- Braiden Grahamnumber 58,
 Northern Ireland,18 years old
- Martin Sherifnumber 67,
 Netherlands,20 years old
Next matches


Ratings
Offense is how many goals the team would score against an average defense on a neutral field. Defense is how many it would give up to an average attack, so lower is better. Hover or tap the chart to see any week.
- Offense, goals scored
- Defense, goals allowed (lower is better)
- League average
| Date | Offense, goals scored | Defense, goals allowed (lower is better) | League average |
|---|---|---|---|
| Aug 17, 2026 | 1.24 | 1.24 | 1.36 |
| Aug 24, 2026 | 1.23 | 1.24 | 1.34 |
| Aug 31, 2026 | 1.26 | 1.24 | 1.37 |
| Sep 7, 2026 | 1.25 | 1.22 | 1.34 |
| Sep 14, 2026 | 1.26 | 1.22 | 1.37 |
| Sep 21, 2026 | 1.27 | 1.20 | 1.36 |
| Sep 28, 2026 | 1.27 | 1.20 | 1.36 |
| Oct 5, 2026 | 1.27 | 1.20 | 1.36 |
| Oct 12, 2026 | 1.34 | 1.22 | 1.39 |
| Oct 19, 2026 | 1.27 | 1.25 | 1.38 |
| Oct 26, 2026 | 1.25 | 1.24 | 1.36 |
| Nov 2, 2026 | 1.24 | 1.24 | 1.35 |
Results
- atArsenal0–2L
- vsChelsea0–2L
- atHull2–2D
- vsIpswich1–0W
- atTottenham0–0D
- vsMan United2–2D
- atBournemouth1–1D
- vsCrystal Palace2–0W


